MA Cross Death Cross on TSLA → 14 matches found
Win Rate: 50% | Best Period: 12M (+52.19%)
Speed: 380ms
█ 7 INSTITUTIONAL PLATFORMS █
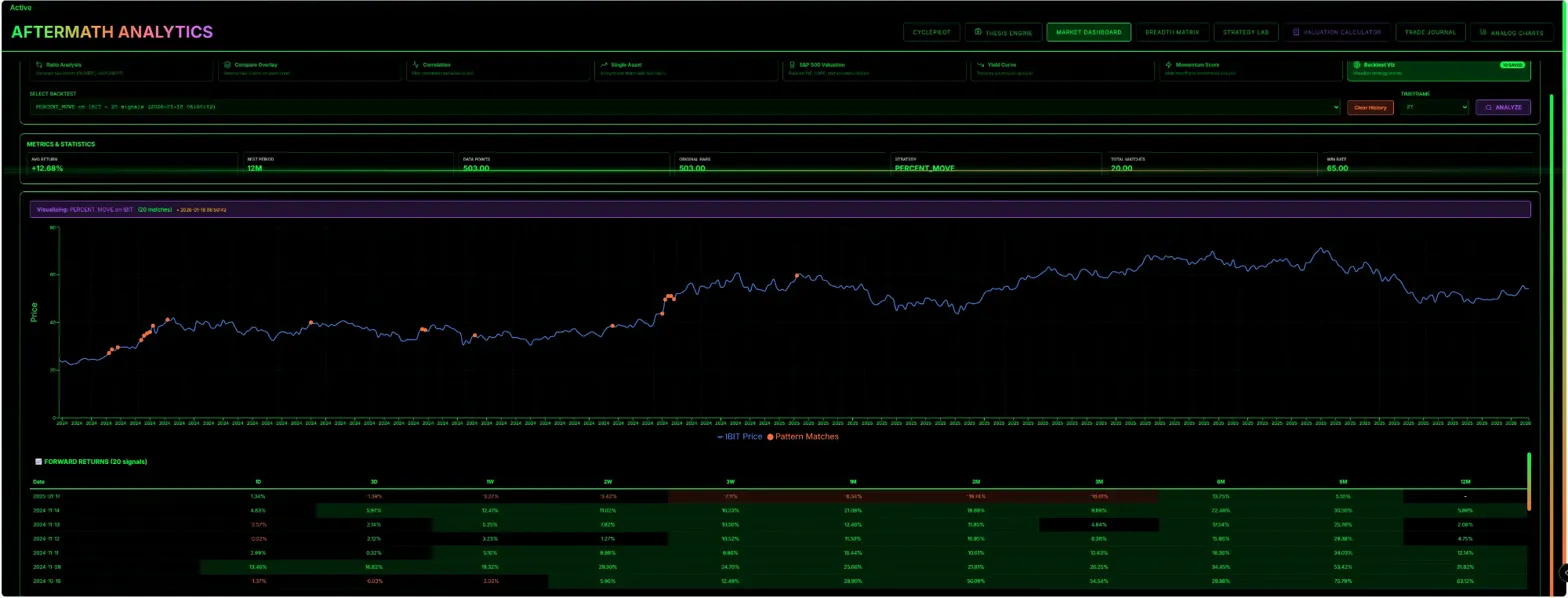
Strategy Lab
Test Any Idea in Seconds
Backtest 13 trading strategies against 43 years of market data. Get results in <500ms with 11 forward return timeframes.
- 13 pre-built strategies (Percent Move, MA Cross, Reversals)
- Smart Scanner finds opportunities in real-time
- Analyzer breaks down win rate, returns, risk metrics
- Interactive charts with pattern highlighting
- Average speed: <500ms
REAL EXAMPLE
PRO TIER
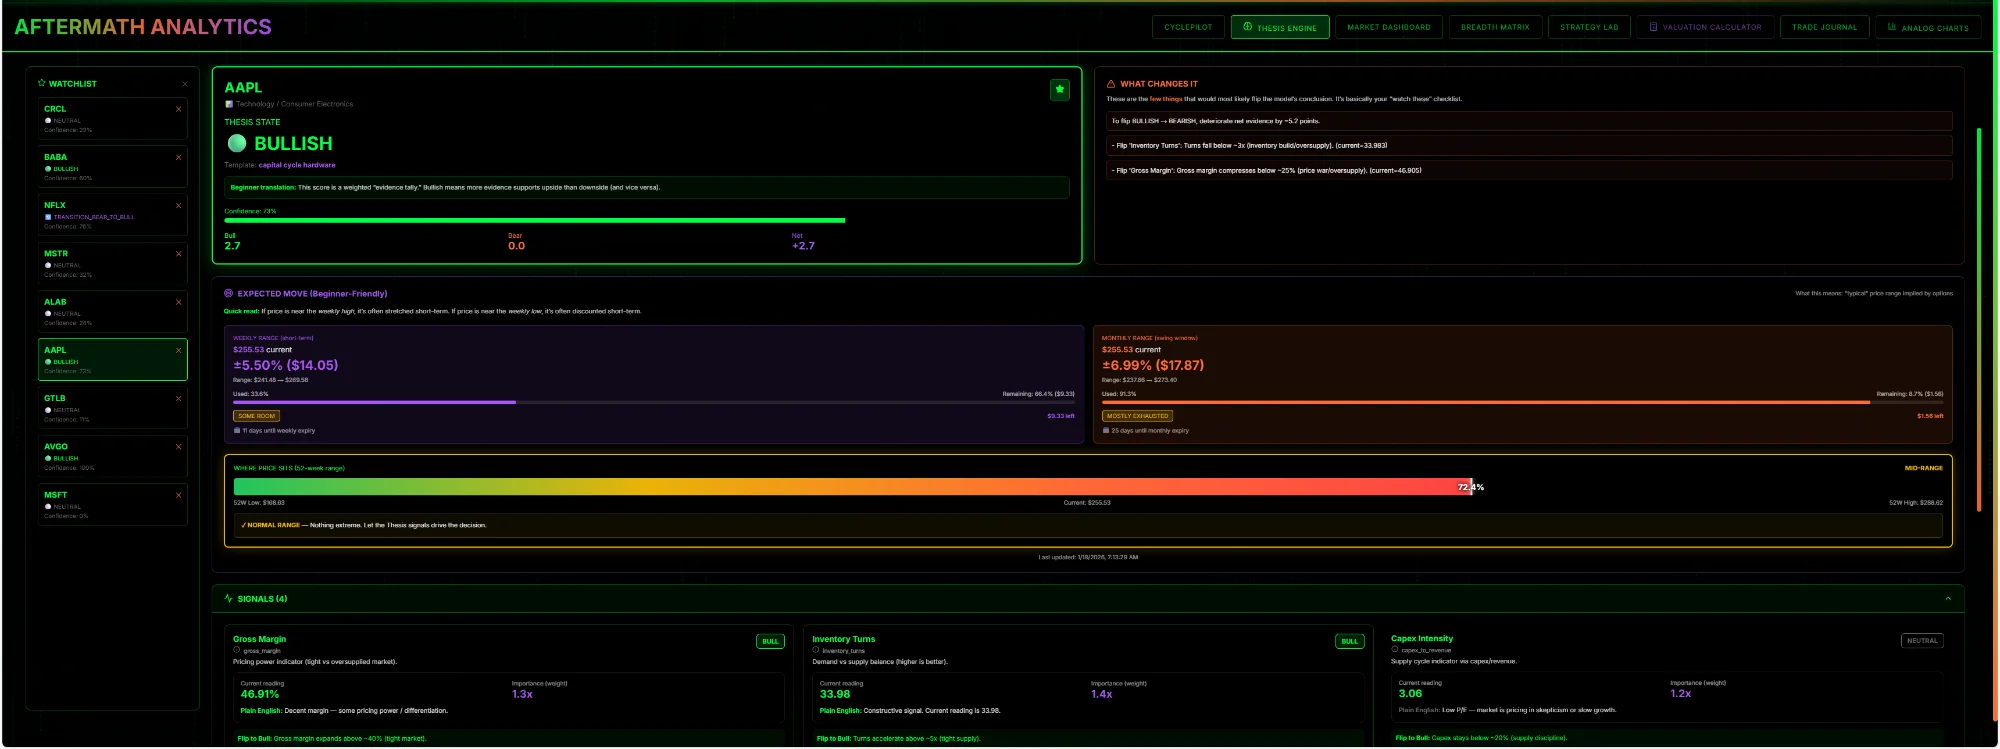
Thesis Engine
AI Fundamental Analysis
AI analyzes company fundamentals and assigns bull/bear ratings. See expected weekly/monthly moves and what changed recently.
- Bull/Bear/Transition state with confidence scoring
- Expected move predictions (week + month ranges)
- "What Changed?" tracking (earnings, upgrades, catalysts)
- Technical + fundamental signal integration
- FCF, leverage, price trend analysis
REAL EXAMPLE
NFLX → Transition_Bear_to_Bull (Low Confidence)
Expected Move: ±9.16% weekly, ±11.95% monthly
Bull Signal: 17.75% FCF margin
Bear Signal: -28.64% price trend (6M)
Expected Move: ±9.16% weekly, ±11.95% monthly
Bull Signal: 17.75% FCF margin
Bear Signal: -28.64% price trend (6M)
AI POWERED
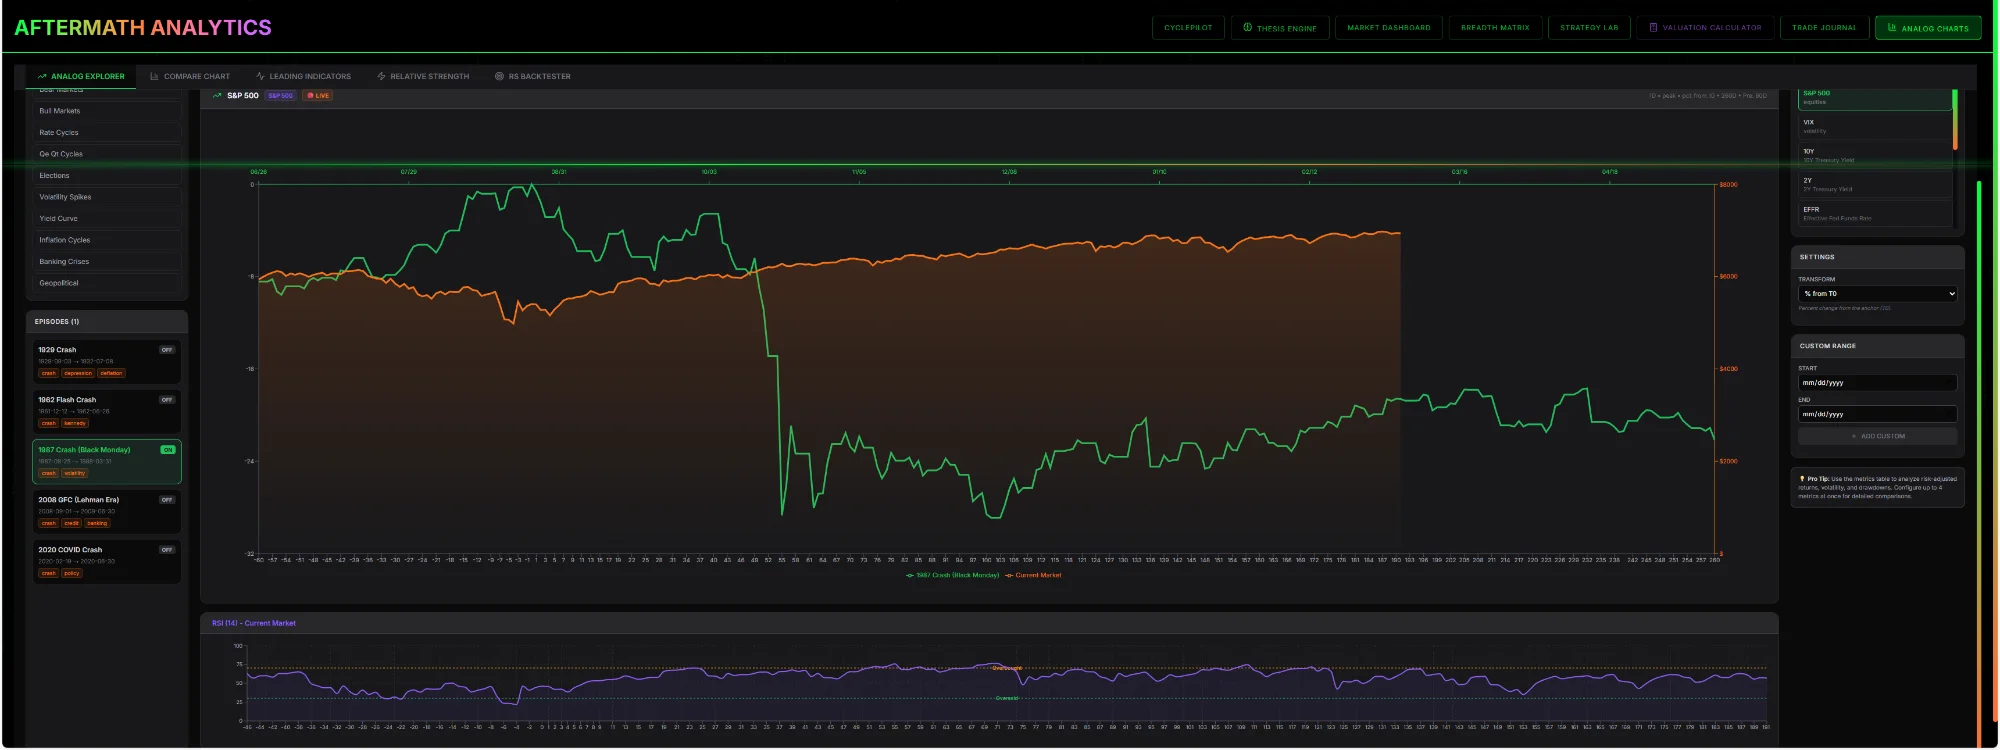
Analog Charts
History Doesn't Repeat, But It Rhymes
Compare today's market to every crash, rally, and cycle in history. See how current conditions match 2008, 2020, or any period you choose.
- Historical overlays (crashes, bull/bear markets, rate cycles)
- Leading indicator analysis (M2 leads BTC by 13 weeks)
- Relative strength scanner with backtester
- Multi-asset comparison (17 metrics available)
- Adjusts for volatility and beta
REAL EXAMPLE
How does 2025 compare to 2008?
Correlation: 23% | Volatility: 45% lower
Max DD Risk: 12% vs 57% (safer)
Correlation: 23% | Volatility: 45% lower
Max DD Risk: 12% vs 57% (safer)
HISTORICAL
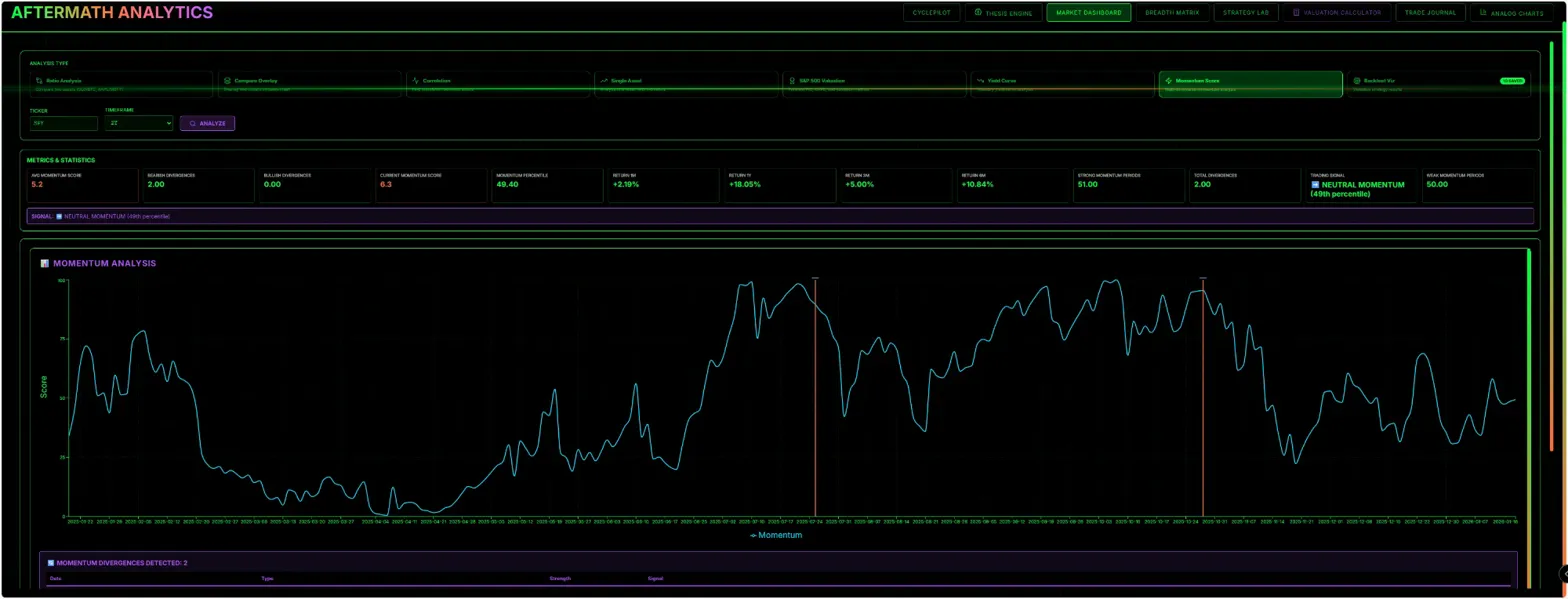
Breadth Matrix
Market Internals + AI Intelligence
Track market breadth with AI-powered summaries for beginners. See participation, McClellan Oscillator, and 70+ ETF performance.
- Market breadth tracking (% above 50MA/200MA)
- McClellan Oscillator + advance/decline ratios
- ETF Performance Tracker (70+ ETFs with smart flags)
- AI summarization for beginners
- Real-time sector rotation analysis
REAL EXAMPLE
Breadth: 71% | Regime: Selective Market
Win Rate: 93% (based on 30 similar setups)
Leaders: XLRE +3.29% (9M), XLI, XLP
Risk: MODERATE | Confidence: HIGH
Win Rate: 93% (based on 30 similar setups)
Leaders: XLRE +3.29% (9M), XLI, XLP
Risk: MODERATE | Confidence: HIGH
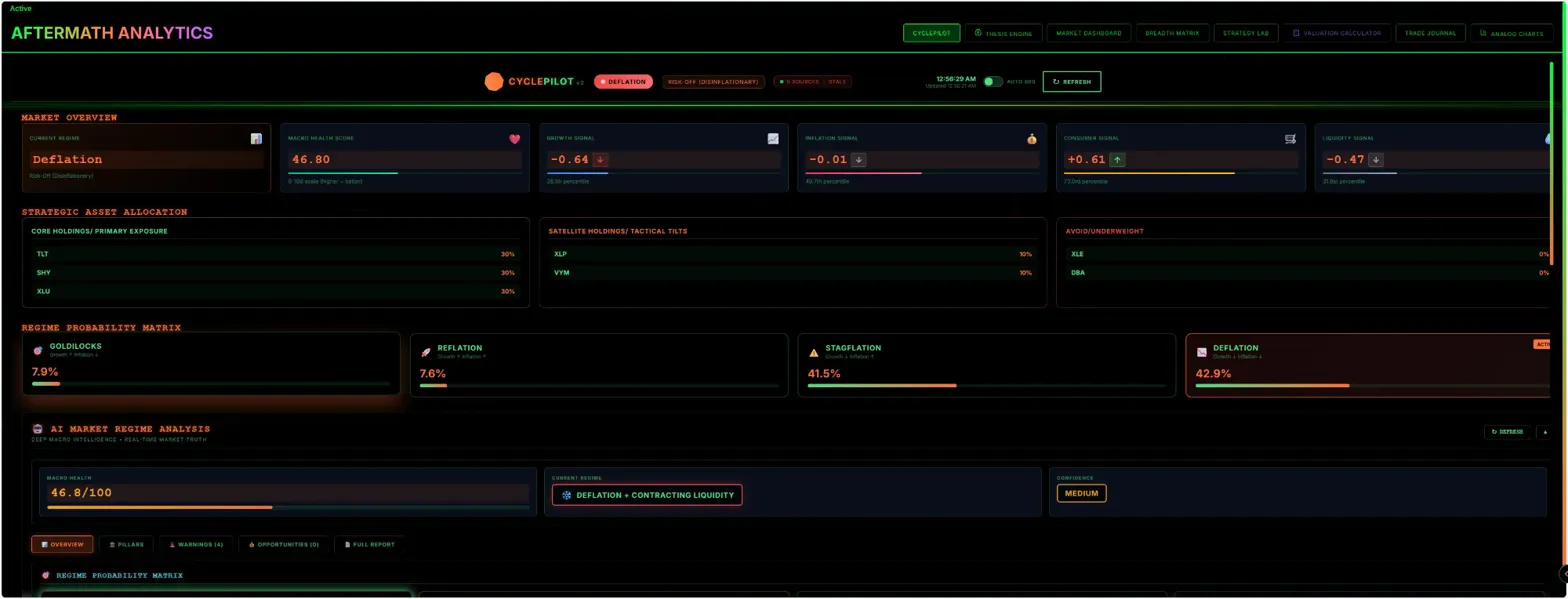
PROPRIETARY
CyclePilot
Detect Market Regimes Before They Happen
Identify trending, mean-reverting, and transitional markets. Get probability scores and asset allocation recommendations.
- Market regime detection (Deflation, Stagflation, Goldilocks)
- Probability matrix for each regime
- Asset allocation recommendations
- Economic pillars analysis (Consumer, Growth, Inflation)
- AI-generated regime reports
REAL EXAMPLE
Current Regime: Deflation (42.8% probability)
Recommended: TLT (30%), SHY (30%), XLU (30%)
Avoid: XLE, DBA
Market Health: 47.3/100
Recommended: TLT (30%), SHY (30%), XLU (30%)
Avoid: XLE, DBA
Market Health: 47.3/100
AI POWERED
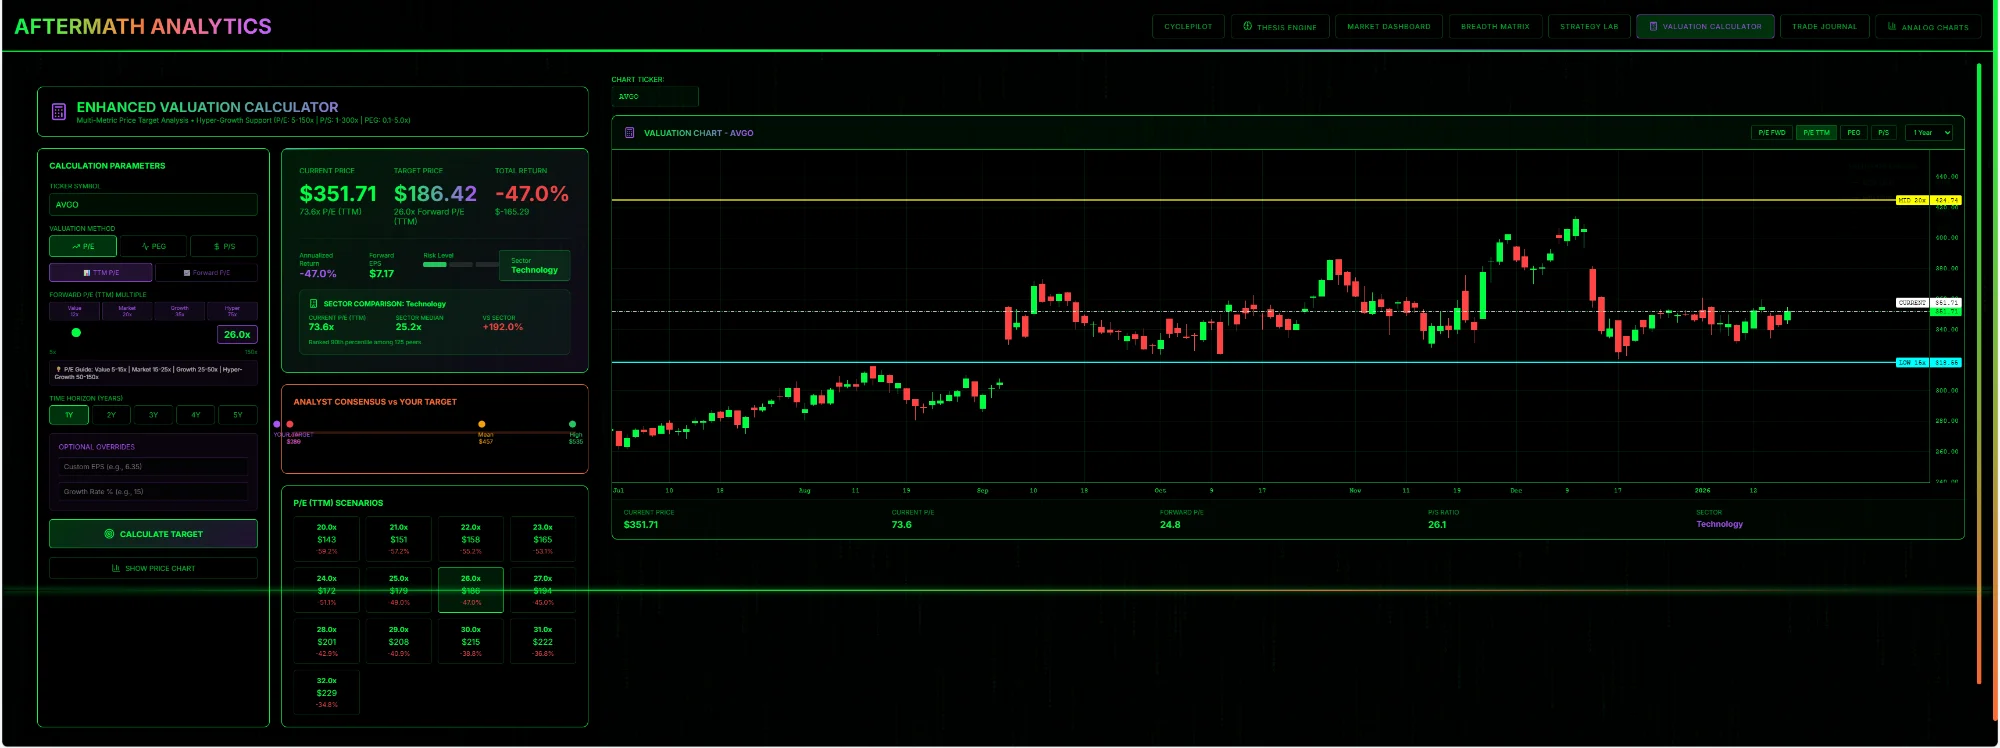
Valuation Calculator
DCF Modeling Meets Market Reality
See if a stock is overvalued or undervalued with multi-metric DCF analysis and sector comparisons.
- Multi-metric DCF analysis
- Current vs market price comparison
- PEG ratio + forward estimates
- Sector benchmarking
- Consensus vs your target comparison
REAL EXAMPLE
AAPL Analysis:
Current Price: $255.53
Market Price: $794.09
Total Return: +210.8%
Verdict: OVERVALUED
Current Price: $255.53
Market Price: $794.09
Total Return: +210.8%
Verdict: OVERVALUED
DCF MODEL
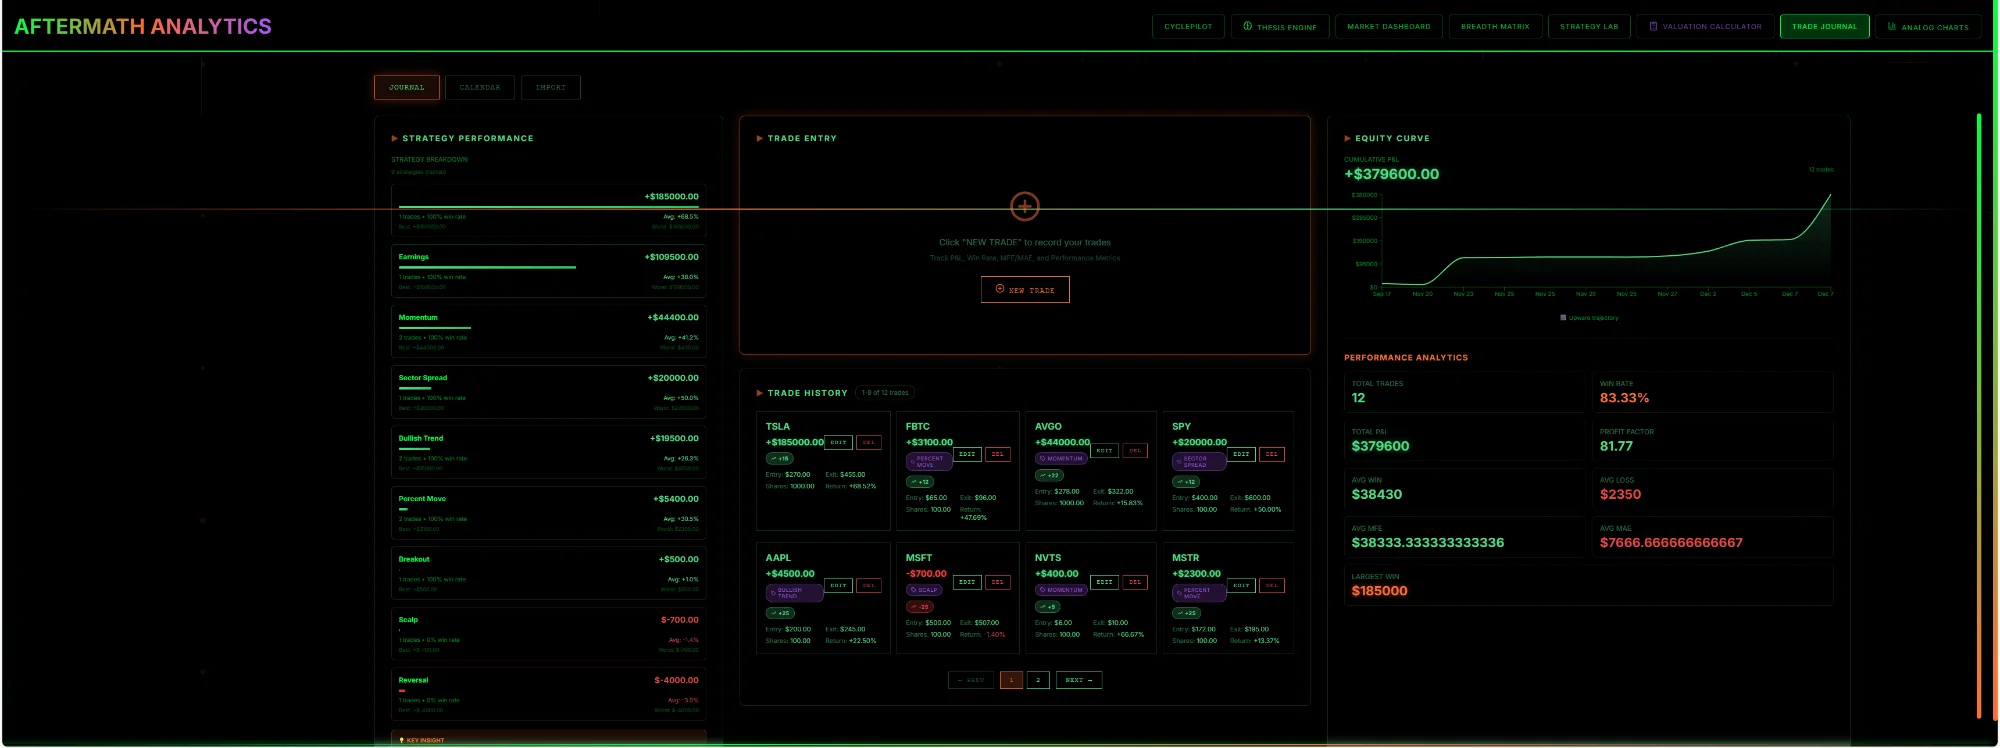
Trading Journal
Track What Actually Works
Log every trade and see which strategies actually make you money. Tag by Strategy Lab setups.
- Strategy-tagged trade logging
- Performance by setup type
- Equity curve visualization
- Win rate, Sharpe, max DD analytics
- Screenshot capture + notes
REAL EXAMPLE
Bullish Trend: +$18,500 (8.5% avg)
Earnings: +$10,500 (5.8% avg)
Total Trades: 12 | Win Rate: 83.33%
Earnings: +$10,500 (5.8% avg)
Total Trades: 12 | Win Rate: 83.33%
ANALYTICS